


Updated June 2026
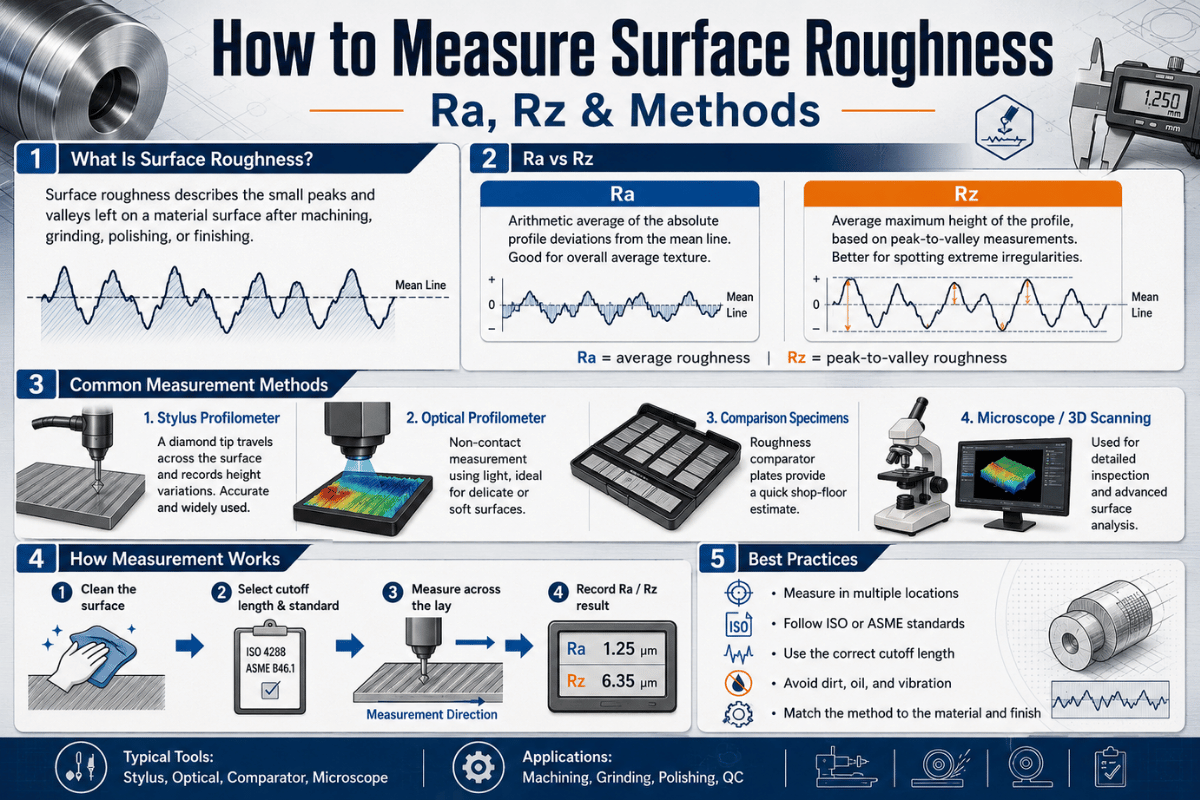
How to measure surface roughness is, in practice, one disciplined workflow: you traverse a stylus or optical sensor across a machined surface, separate the fine texture from waviness and form with a cutoff filter, and report a single parameter, almost always Ra, the arithmetic average roughness, in micrometres (µm) or microinches (µin). That sounds simple, and the number on the gauge look definitive. It usually isn’t. Two readings of the same surface can disagree by a wide margin if the cutoff length, stylus direction, or parameter is set wrong, and a part can pass its Ra tolerance yet still leak, seize, or wear out. Reliable surface roughness measurement depends as much on the measurement system and settings as on the instrument. This guide walks through the roughness parameters, the measurement instruments, the actual step-by-step procedure, and the one filtering step most measurements get wrong, so that understanding and controlling surface roughness becomes repeatable rather than a guess, whether the part is a smooth surface or one of the rough surfaces near a saw cut.
Quick Specs
| Most common parameter | Ra (arithmetic average roughness), in µm or µin |
| Core instruments | Contact stylus profilometer; non-contact optical (confocal, interferometry, focus variation) |
| Governing standards | ISO 21920 series (2021, replaces ISO 4287/4288/1302); ASME B46.1-2019 |
| Typical stylus tip | 2 µm radius, 0.75 mN force (per ISO 3274) |
| Cutoff (λc) range | 0.08–8 mm, selected from the expected Ra |
| Conversion anchor | 125 µin ≈ 3.2 µm; 63 µin ≈ 1.6 µm; 32 µin ≈ 0.8 µm |
What Surface Roughness Actually Is (Roughness vs Waviness vs Form)
 1")
Surface roughness refers to the fine peaks and valleys left on a surface by the manufacturing process, quantified as the average vertical deviation of the real profile from a mean line over a defined sampling length. The measurement of surface roughness captures how far the real surface departs from its ideal geometry at short wavelengths, understanding surface roughness starts with seeing it as the deviation of a real surface from its ideal form, not as a single quality grade.
It’s only one of three components of surface texture. Any machined surface’s full geometry is a stack of three wavelength bands: form (the overall shape, longest wavelength), waviness (medium-wavelength undulation from machine vibration or an unbalanced grinding wheel), and roughness (the shortest-wavelength tool or process marks). Each roughness measurement isolates that shortest band and discards the rest.
That separation is the whole game. Each profilometer captures one combined surface profile, then a filter strips out the long wavelengths so only the roughness profile remains, the height of the profile from the mean line is what the instrument turn into a number to characterize the surface. These surface characteristics and surface features (the small surface irregularities, or irregularities on the surface, left by the tool) are exactly what a roughness measurement quantifies. As the University of Southampton’s metrology guide puts it, roughness and waviness are rarely found in isolation — “most surfaces are a combination of all three and it’s usual to assess them separately.” There’s no fixed wavelength where waviness becomes roughness; the boundary is set by the cutoff you choose, which is why two engineers can measure “the same” surface and report different numbers. Per ASME B46.1-2019, lay, the dominant direction of the surface pattern, is a fourth descriptor that controls how you orient the instrument.
In practice this gap bites. A machinist on the shop floor can reject a ground shaft because its Ra 0.4 µm reading “fails”, when the gauge was wrongly folding waviness from a worn spindle bearing into the number, the roughness was inside spec the whole time, and the expensive mistake was the cutoff, not the part. That failure mode is common precisely because each ISO wavelength filter (a 0.8 mm cutoff captures different content than a 2.5 mm one) changes the result, so separating the bands correctly matters before you trust any surface roughness reading.
Surface Roughness Parameters: Ra, Rz, Rq, and What Ra Hides
 2")
Ra is the arithmetic average roughness, the mean of the absolute deviations of the roughness profile from the mean line over the evaluation length, and Rz is the average maximum height, the mean of the five largest peak-to-valley distances across the sampling lengths. Ra is stable and easy to control, so it dominates drawings; Rz is more sensitive to isolated scratches and burrs and to the highest peak in the trace. Ra is an amplitude average only, which is the catch: like all amplitude parameters it measures vertical height, but it throws away the shape of the profile. Two parts at different roughness levels can still need the same parameter, and two parts at the same Ra can have very different roughness of a surface in function. Matching the parameter to the job is what turns a raw number into real surface quality, high roughness isn’t automatically bad, and a low number isn’t automatically good.
Two surfaces can share an identical Ra and behave in opposite ways. A plateau-honed cylinder bore (deep oil-retaining valleys, flat bearing peaks) and a sharp, peaky turned surface can both read Ra 0.4 µm, yet one seals and lubricates and the other tears a seal apart. The difference lives in skewness (Rsk): negative skew means valley-dominated (good for bearing and oil retention), positive skew means peak-dominated (good for adhesion, bad for seals). If function depends on sealing, bearing, or fatigue, specify Rsk or Rz alongside Ra, Ra alone can’t distinguish them.
| Parameter | What it captures | Best used for |
|---|---|---|
| Ra | Arithmetic average deviation from the mean line | General control; most drawings and process monitoring |
| Rz | Average of 5 max peak-to-valley heights | Sealing faces, fatigue-critical parts, scratch detection |
| Rq (RMS) | Root-mean-square deviation (weights peaks more) | Optical surfaces, statistical analysis |
| Rt | Total height, single worst peak-to-valley over the evaluation length | Coating thickness, leak paths, defect screening |
| Rsk | Skewness — peak-dominated vs valley-dominated asymmetry | Bearings, seals, lubrication, paint adhesion |
Parameter definitions per ISO 21920-2 / ASME B46.1-2019.
What does Ra tell you, and what doesn’t it?
Ra tells you the average height of the texture, full stop. It’s reproducible, insensitive to a single odd spike, and good for catching gradual process drift over a production run, a worn insert or a loaded grinding wheel pushes Ra up steadily as it dulls.
What Ra doesn’t tell you: whether the profile is peaky or valley-rich (skewness), how tall the worst single feature is (Rt/Rz), how the texture is spaced (RSm), or which direction it runs (lay). A bearing journal and a gasket face can carry the same Ra 0.4 µm callout and need completely different real surfaces. Treat Ra as a first filter, then add a shape or extreme-value parameter when the function demand it.
How to Read a Surface Finish Callout (125, 32, 0.8 Ra)
 3")
A surface finish callout such as “0.8” or “Ra 0.8” means a maximum arithmetic average roughness of 0.8 µm; an older imperial callout of “32” means 32 µin, which is the same finish. If a drawing shows only a bare number with the tick symbol, the ISO default applies: Ra, measured with five sampling lengths and a 0.8 mm cutoff.
That value is the headline, but a full ISO 1302 / ISO 21920-1 symbol can also carry the sampling length, the parameter (Ra vs Rz), an upper and lower limit, the production method, the lay direction, and a machining allowance.
| Ra (µm) | Ra (µin) | ISO grade (N) | Typical process |
|---|---|---|---|
| 0.1 | 4 | N3 | Lapping, fine honing |
| 0.2 | 8 | N4 | Honing, precision grinding |
| 0.4 | 16 | N5 | Grinding, fine turning |
| 0.8 | 32 | N6 | Grinding, precision turning (seal faces) |
| 1.6 | 63 | N7 | Turning, milling, wire EDM |
| 3.2 | 125 | N8 | As-machined turning / milling baseline |
| 6.3 | 250 | N9 | Rough machining, casting cleanup |
Conversion: 1 µin = 0.0254 µm. Process column is typical, not guaranteed, see the process bracket below.
Contact vs Non-Contact: Instruments That Measure Roughness
 4")
Use a contact stylus profilometer for traceable Ra/Rz on most metal parts, and a non-contact optical instrument when the surface is too soft, too small, too reflective, or when you need an areal (3D) picture rather than a single line. Mechanically, a stylus drags a fine diamond tip across the surface and converts its vertical motion into a profile; an optical instrument read the surface with reflected light instead of touching it. Both are valid measurement instruments, the right measuring instrument depends on the part, the parameter, and the budget. Here, a contact measurement uses a probe (the stylus) dragged across the surface; an optical profile measurement reads the surface with reflected light. Portable roughness meters give a fast shop-floor number, while a lab profilometer give an accurate measurement traceable to a standard. Every one of these methods has the same point: to measure the roughness, to measure the surface roughness consistently and report comparable surface texture parameters.
| Instrument | Principle | Profile / Areal | Best use |
|---|---|---|---|
| Skidded stylus gauge | Stylus + skid datum (contact) | Profile (Ra) | Shop-floor go/no-go on Ra |
| Skidless stylus profilometer | Stylus on precision straightness datum | Profile (Ra, Rz, Rsk) | Traceable lab measurement |
| Confocal microscope | Optical focus through depth (non-contact) | Areal (Sa, Sq) | Small or delicate parts |
| White-light interferometry | Phase-shift interference (non-contact) | Areal | Very smooth / optical surfaces |
| Focus variation | Optical focus stacking | Areal | Steep, rough, textured surfaces |
| Comparator block | Tactile / visual vs known specimen | None (subjective) | Fast estimate, no instrument |
- Traceable to national standards (NIST/NPL reference specimens)
- Direct Ra/Rz/Rsk, unaffected by surface colour or reflectivity
- Limit: tip can scratch soft surfaces; one line only; slower
- Limit: tip radius (2–5 µm) blunts the narrowest valleys
- No contact damage; full areal (3D) map; fast over an area
- Sub-nanometre vertical resolution on smooth parts
- Limit: struggles on steep, transparent, or very shiny surfaces
- Limit: areal Sa isn’t numerically equal to profile Ra
What are the methods of measuring surface roughness?
There are three practical families. Contact profiling drags a stylus across the surface and is the traceable default for Ra and Rz. Non-contact optical methods, confocal microscopy, white-light interferometry, and focus variation, use light to measure the surface and produce areal maps without touching it.
Comparison methods use a tactile/visual roughness comparator for a quick estimate when no instrument is on hand; the underlying optical-topography techniques are well documented in patents such as US 4,340,306 on phase-shifting interferometry. Atomic force microscopy sits beyond these for nanometre research work.
How to Measure Surface Roughness Step by Step
 5")
A valid roughness reading is a six-step procedure, not a single button press. Skip the calibration or the lay orientation and the number is decorative. This is the standard method for measuring surface roughness with a portable or bench stylus tester, the stylus moves across the surface at a constant speed, and the profile roughness it records is converted into Ra.
Done in this order, roughness can be measured the same way twice; done out of order, the roughness average drifts with the operator.
- ✔1. Clean the surface. Wipe off oil, chips, and dust, a single particle reads as a peak and inflates Rz.
- ✔2. Calibrate against a reference specimen. Verify the gauge on a traceable roughness standard (for example a NIST SRM 2073a-type specimen) before the shift.
- ✔3. Set the parameter. Match the drawing, Ra, Rz, or Rsk. Measuring Ra when the print calls Rz is a silent failure.
- ✔4. Choose the cutoff (λc). Pick it from the expected Ra (see the selector below) — this sets the sampling and evaluation length.
- ✔5. Orient perpendicular to the lay. Traverse across the tool marks, not along them. Measuring along the lay can read 2–3× smoother than the true value.
- ✔6. Traverse, then take several readings. Run the full evaluation length (five sampling lengths) and average several positions; surfaces aren’t uniform.
A standard stylus uses a 2 µm tip radius at roughly 0.75 mN force (per ISO 3274; Mitutoyo Surftest-class defaults); a 5 µm / 4 mN tip is used for coarser surfaces. A skidded gauge rests a skid on the surface peaks and mechanically filters out waviness, convenient on the shop floor, but it can under-report on wavy or curved parts. A skidless gauge rides on an internal precision datum and is required for Rz, Rsk, and traceable work. Traverse speed also matters: too fast and the stylus rounds off sharp valleys.
“It is entirely possible to measure a single roughness by two different methods, and obtain different results. Following ISO methods will not always give the best, or the most appropriate answers. When quoting roughness information, it is always best to provide as full information as possible regarding the measurement method, the tools used, and the parameters applied.”
University of Southampton, Roughness Measurement: A Guide (Engineering)
The Cutoff-Length Step Most Measurements Get Wrong
 6")
The cutoff length (λc) is the filter wavelength that separates roughness from waviness, and you select it from the expected Ra, not from the size of the part. Get it wrong and a longer measurement makes things worse, not better: too large a cutoff folds waviness into the Ra reading, and too small a cutoff filters out real roughness. This single setting is why a part can sit inside its Ra tolerance on one gauge and fail on another. This standard ladder comes from ISO 4288 (carried into ISO 21920-3) for non-periodic profiles, the kind most machining produces.
| Expected Ra (µm) | Cutoff λc (mm) | Sampling length (mm) | Evaluation length (mm) |
|---|---|---|---|
| > 0.006 to 0.02 | 0.08 | 0.08 | 0.4 |
| > 0.02 to 0.1 | 0.25 | 0.25 | 1.25 |
| > 0.1 to 2 | 0.8 | 0.8 | 4 |
| > 2 to 10 | 2.5 | 2.5 | 12.5 |
| > 10 to 80 | 8 | 8 | 40 |
Default when nothing is specified: Ra, 5 sampling lengths, 0.8 mm cutoff, 300:1 bandwidth. Source: ISO 4288 selection table.
Worked example: a part turned at a feed of 0.1 mm/rev with an 0.8 mm nose radius has a theoretical floor Ra of roughly f²/(31.2·r) = 0.1²/(31.2 × 0.8) ≈ 0.4 µm. Real Ra runs higher because of built-up edge, vibration, and tool wear, but 0.4 µm lands in the “0.1 to 2 µm” band, so you would measure it with a 0.8 mm cutoff over a 4 mm evaluation length. Change the feed rate and nose radius and the achievable Ra, and therefore the correct cutoff, moves with it.
It isn’t. Accuracy comes from the correct cutoff, not a longer traverse. Machinists on metrology forums repeatedly trace “mystery” Ra disagreements back to a cutoff that was too large for the surface, it pulled waviness into the reading. Set λc from the expected Ra first; the evaluation length then follows as five times the cutoff.
Typical Surface Roughness by Process (Grinding, Turning, EDM, Milling)
 7")
Before you trust any measured Ra, sanity-check it against what the process can realistically produce. This bracket table give typical achievable Ra for common processes, useful both for choosing a finishing route and for catching a measurement that’s physically impossible (a turned bore doesn’t read Ra 0.05 µm). These are typical ranges from production-method data in ASME B46.1 and cross-validated machining data; the floor depend on tooling, material, and rigidity.
| Process | Typical Ra (µm) | Notes |
|---|---|---|
| Lapping | 0.012–0.1 | Mirror finishes, gauge blocks |
| Honing | 0.025–0.4 | Bores, plateau finishes for sealing |
| Precision grinding | 0.1–1.6 | 0.1–0.8 typical; seal/bearing faces |
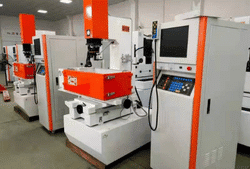
| EDM (die-sink) | 0.4–3.2 | Set by spark energy |
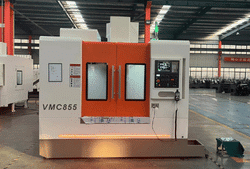
| CNC turning | 0.4–6.3 | Driven by feed and nose radius |
| Milling machines | 0.8–6.3 | 3.2 µm as-machined baseline |
| Drilling | 1.6–6.3 | Bore walls |
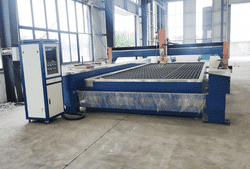
| Sawing | 1.6–25 | Stock cutoff, pre-machining |
Material changes the floor: a ductile alloy that builds up on the edge finishes rougher than the same cut in cast iron, while gummy grades like soft aluminium or stainless steel often need a finishing pass to hit a low Ra. When a single turned or ground operation can’t reach the callout, the realistic route is precision grinding equipment or honing rather than ever-finer turning.
What’s Changing in Surface Metrology (ISO 21920 and Areal Sa/Sq)
 8")
If your drawings still cite ISO 4287, ISO 4288, or ISO 1302, they now reference withdrawn standards, and that is a compliance task you should schedule, not a market trend to watch. In December 2021 the ISO 21920 series formally replaced ISO 4287, ISO 4288, ISO 1302 and parts of ISO 13565 for profile surface texture.
Familiar parameters (Ra, Rz, Rsk) survive, but symbol rules, default conventions, and some definitions changed. Practical action: audit your drawing templates and inspection reports for old standard citations and update the callouts as parts are revised, an inspection report that cites a withdrawn standard is a finding waiting to happen in an audit. In regulated industries such as automotive, where a sealing or control surface carries a functional EN ISO callout, evaluating surface quality against the current standard is part of the sign-off, and surface properties such as skewness increasingly appear on the print alongside Ra.
A second shift moves from 2D profile to areal. Profile Ra samples a single line; areal parameters, Sa and Sq under ISO 25178, map the whole surface and describe textures (honed plateaus, laser-textured seals, additive surfaces) that a single trace can miss. New calibration frameworks such as ISO 25178-600/-700 and the 2025 interferometry instrument standard are pushing non-contact optical and even in-line measurement into higher-value production. Areal isn’t a replacement for Ra on a routine machined part, it’s the tool to reach for when function depends on the texture’s shape, not just its average height. (The measurement-equipment market is growing at roughly mid-single-digit rates, but the real driver here is the standards change and the move to functional, shape-aware specs.)
Frequently Asked Questions
How is surface roughness (Ra) calculated?
View Answer
How is Rz calculated, and how does it differ from Ra?
View Answer
What are the units of Ra?
View Answer
How do I measure a 0.8 µm (Ra 32) finish?
View Answer
Can I measure surface roughness without a profilometer?
View Answer
How does surface roughness affect part performance?
View Answer
Why We Wrote This
As a builder of CNC turning, milling and grinding machines, ANTISHICNC sees the same surface-finish disputes land on the shop floor every week: an Ra callout that passes on one gauge and fails on another, almost always traced back to cutoff length or lay orientation. This guide pulls the standards (ISO 21920, ISO 4288, ASME B46.1) and the practical procedure into one place so a finish spec gets measured the same way twice. Reviewed by the ANTISHICNC technical team.
Related Articles
References & Sources
- SRM 2073a Roughness Calibration SpecimenNational Institute of Standards and Technology (NIST)
- Good Practice Guide No. 37: Surface Texture Measurement Using a Stylus InstrumentNational Physical Laboratory (NPL)
- ASME B46.1-2019: Surface Texture (Roughness, Waviness, Lay)ASME / ANSI
- ISO 1302:2002 GPS, Indication of Surface TextureInternational Organization for Standardization
- Roughness Measurement: A GuideUniversity of Southampton, Engineering
- Understanding Surface Quality: Beyond Average Roughness (Ra)ASEE
- ISO 25178-603:2025, Areal Phase-Shifting Interferometry InstrumentsISO